Showing posts with label BI Models. Show all posts

Friday, March 9, 2018

Designing Data Driven applications


Data is one of the key factors for businesses to identify its operational strengths and weaknesses. The key insights from data analysis can point out opportunities to boost performance and efficiency. Therefore the data-driven designing remains as much of an art as it is a science, especially for customer-facing applications with both a large number of users and large datasets. How an application presents data plays a huge role in UX
Following are some of the tips and tricks to develop simple and clear data-visualization for app dashboards, web pages, and so on.

UNDERSTAND CUSTOMER JOURNEY TO DELIVER RELEVANT DATA

Enabling customers to create their digital persona such as managing their accounts, checking their usage, and personalizing their services, etc is a game changer.
The three checkpoints that need to be considered are:
Inform: Customers pay attention when they’re offered helpful and useful data. For example, a travel booking tool that analyzes historical data to advise customers on when to purchase travel.
Connect: Data-driven apps and personalized experiences can connect users to brands. For example, an online shop that uses QR codes and a mobile app to blend advertising and online shopping.
Motivate: The ultimate goal of data is to influence customer behavior. Together, data and context drive participation and engagement.

EMPLOY USER PERSONAS TO DESIGN USEFUL DATA-DRIVEN DASHBOARDS

As much as artificial intelligence and machine learning will keep improving, most organizations will still need human intervention to crunch uncategorized data. Data-driven applications tend to be used by multiple persons within or outside of an organization, you need to identify those personas so you can organize your information architecture wireframes and tasks to meet everyone’s needs.

Here every user/persona has different taste in the data visualization, but the design takes care of each users interest
Erik Klimcz, the Senior Design Leader at Uber and Advanced Technologies Group, shared some actionable tips on Medium. He suggests UX designers need to first identify, then define users or personas for every project.

ACCESSIBILITY OVER AESTHETICS

It’s not just about making heavy, contextual data fluid and appealing. You also want to design data presentations that provide clarity on the following
Users should know what data is the most important: One vital UX design principle is to observe and implement a hierarchy of information – in this case, visual hierarchy. You want to organize, arrange, and prioritize the most important data first, and additional data later. Of course, the order of priority will vary depending on the application’s user. Not only does doing this declutter the dashboard, but it also helps direct the user’s focus on what’s important to them in an easy to follow, less overwhelming way.

In the above example, we notice the captured data is given higher priority, followed by lifetime data and goes further to activity breakdown
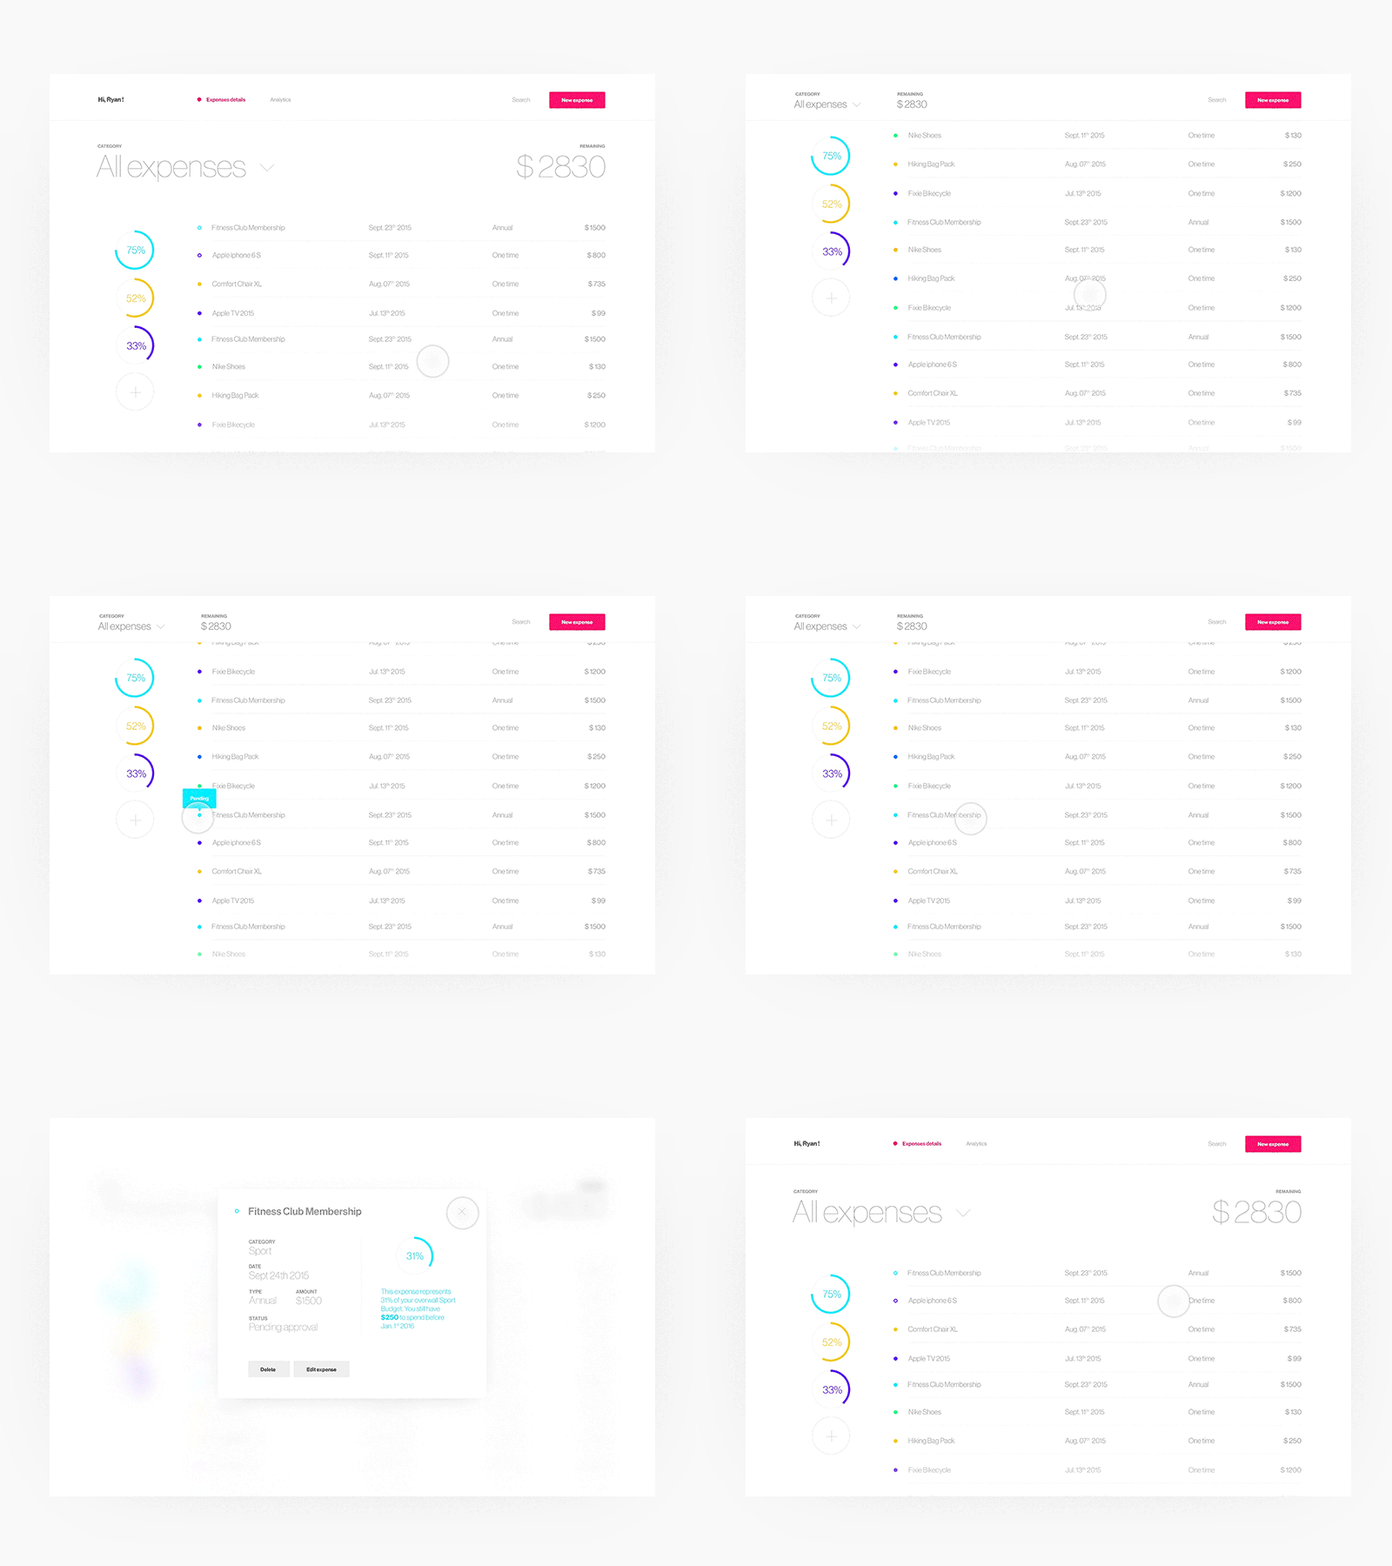
Users should be able to comprehend the logical flow of data: Simplicity plays a major role in helping the user to connect the data to a certain outcome. You can add an intuitive drop-down menu, which when the user clicks, slides down to reveal additional information, and then specific tasks or items. People love this, and it’s gaining popularity already.
You can use clickable links or rollovers to reveal more information. Also, functions such as slide-to-reveal data and zoom-in-to-reveal are great ways to include additional information or highlight key data points. All using simple, natural gestures. This allows users to click on the links or rollovers they perceive as important to their job and leave the ones they consider less important.

This example shows a simple, elegant and comprehensive view of the data using various interactive functions
Use hover animations: You can use hover animation effects to add more zing, engagement, and usefulness to the (seemingly) dull data. Hover animations are particularly actionable for supplying additional information on specific tasks or items while helping to organize and clean up your data-driven application.
Users should be able to understand what the data means: After organizing and prioritizing data on the dashboard, the next step is to break down the data into separate pages. If it is possible to categorize the information, be sure to allocate different pages/screens for different data bundles.
Users should be able to understand the next step to take: Following hot on the steps above, it becomes easier for users to identify and relate patterns in the raw data – another key win to aim for when designing for data-heavy applications. When the data visualization tools you use help the users to make sense of big data, that’s when you know you have done a great job.

CONCLUSION

The purpose of UX design is to convey a message in a clear and actionable way. This is especially crucial for designing data-heavy applications. In this case, the business of good design is to help analysts or managers or end users make an informed decision. And users cannot interpret and use raw data to inform a decision if they do not make good sense of it and how it is presented. Designing for data-heavy UX projects should not be as exasperating as it seems. The above tips and tricks can help you figure out how to design for data-heavy interfaces.

Monday, January 29, 2018

How To De-clutter Your BI Dashboards To Discover Key Insights


Data, the primary key to everyday business opportunities, has gotten complex over the years due to technological challenges like data blending and data wrangling. The numerous complexities are a result of the scope and variety of big data and the integration of visualization and analytics tools. These glitches have not only slowed down data preparation but also affected the analytics stage. The effective use of data preparation tools can reverse the cycle of 80:20 ratios for data preparation and analytics into 20:80 proportions. In order to bring about this reversal, and accelerate the data preparation process, reduce waste and rework, and minimize complexity, data dashboards – the center of all data compilation and extraction- have to be effectively organized.
A data dashboard is the core information management system that helps to visually track, analyze and display the metrics of your business, key performance indicators, and other tandems that constitute the health of a business. These dashboards are customized according to the workflow process, and it is a superfluous system that connects all your data in the backdrop but presents it in the form of gauges and interpretable data. While the use of this system ensures real-time management of a business with integrated technology, most businesses fail to use them to their maximum potential because of inefficient structuring or organizing.
Three effective ways to prep your data dashboard for better productivity within a business are:
1. Streamline the right metrics: Most times, businesses just load up all their data and pick only the flashy appealing numbers and leave out the gruesome details. This is because the data entered is having too many metrics to filter out. The best strategy would be to set up only the crucial metrics for your business and streamline the rest of the data around these core metrics so that data inputs are the same but only better. Marketing data is the core of operations for an advertising company. If this company has finance at its core and marketing aligned as a subset, then the data generated will be drastically different from what is really required.
2. Don’t bog down with vanity metrics: A services related business does not require a crucial input from social media score, so, moving it to a different composition can ensure that sales are the prime focus and marketing is a secondary focus. All irrelevant metrics are crucial to a business and cannot be ignored, ensuring that all these dashboards are separately set up, monitored, and then integrated into the core reports can dramatically double up data efficiency.
3. Integrate into the open: Every department in a business is overprotective and keen on not opening their books to other departments. Just like a business needs open channels between all departments, the data on the dashboard should be open to the crucial analysts of each department and not restricted to a narrow channel at the end of the line. Allowing branching out ensures that some key factors can be interchangeably used by the unrelated department to identify crucial problems.
How Can you help?: While the above factors can benefit across the business, individual analysts too should help to de-clutter and effectively streamline data on the dashboard.The best ways to regulate the effective prep data for the dashboard would be to:
  • Focus on what task you have been assigned so that too many people do not enter irrelevant feeds into the dashboard. Organize your team to handle each metrics individually, and streamline the dashboard.
  • Don’t focus on dolling up a visually appealing end report. Set data as your priority on your dashboard and use the actual data to finish the end reports. This will ensure a solid output rather than just figurative numbers.
  • Stay away from data that is beyond your scope. Feeding on data through automation tools can help avoid human errors.
  • Do not dissect the data till you have integrated them across all metrics of the business. Instead of trying to break down data where and how you want, categorical logging will ensure the data is recorded at every required base and not lost in transition through channels.
  • Follow the business’s categorization protocol, remove duplicate data, and scrub out both the dirty data (useless data) and outdated data.
  • Lastly, don’t try to fit the data from the board into the wrong puzzle, sort it and match it. Also, ensure to check, revise, and update any misconnecting data that can churn out inefficient results.
The constant up gradation of algorithms will require the analysts and users of data dashboard to think on their feet and adapt clear-cut methods to align the dashboard to generate utility value. Every business has its own needs, but if they reorganize and simplify the collection of data, then there could be no hurdles to insightful analytics.

Friday, January 19, 2018

How Big Data Will Change Businesses In 2018

Market trends suggest that with an approximate growth of about $7.3 billion in 2018, the big data market size will be bound to break the $40 billion mark by the end of the year. The demanding growth in big data analytics has induced various industries to begin implementing and updating their big data systems to adapt to the higher workloads.

Structured and unstructured data has cracked the world of computational data and analytics into a divide. While algorithms and tools have enabled the easy categorization of structured data, unstructured data is left unsorted due to its complexity beyond the comprehension of simple tools. Unstructured data has been left out of most databases and wasted simply due to the sheer impossibility to classify or structure it into simpler forms.
Increased integration of business intelligence tools:
The implementation of machine learning, artificial intelligence (AI), and neural networks into the working processes of industries have begun to rapidly shrink the gap between structured and unstructured data. The intensive research in the fields of business intelligence is ensuring that all unstructured forms of data are analyzed, organized, scaled, and even used to predict trends which will not just generate viable data but also offer the required advantage for businesses to tap into unforeseen patterns to dramatically improve their key processes. Forrester has predicted that, with more than 70% of businesses integrating AI modules, businesses will have to be quicker and “think on their feet” to quickly tap into the upcoming trends and beat the competition.
The structuring of dark data:
Dark data that has constantly been discarded as unusable and left literally in the dark due to the unavailability of resources or appropriate tools will be streamlined into usable data with the use of these business intelligence tools. By processing and analyzing the old databases as well as that which will be acquired in the future, these business intelligence tools will help detect the often unaware or neglected quality anomalies. This enhancement will not just enable a correction in the business process but also augment the success of many businesses that have lost out on the competition.
Increased impact of IoT:
Further, Internet of Things (IoT), which has thus far proved to have a great impact on big data, will create a greater wave in the transfer of data through sensor technology. Many businesses are benefiting better by cashing in on the benefits of IoT enabled networks as compared to those businesses that are still hooked to outdated forms. An apparent benefactor of IoT would be retail businesses as they would be able to analyze their customer behaviors and other trends in real time through the data generated from their equipped smart stores. A simple sensor on a rack can help with real-time inventory management.
The greater shift from remote servers to cloud storage:
Another component that business will have to adapt to without fail for the success of the integration of these business intelligence tools would be cloud storage. These business intelligence components would cease to exist if businesses fail to utilize either or both cloud storage and cloud computing platforms to effectively collect, analyze or process any data. Accessibility to real-time data without the constraint of limited storage, like that of remote servers, is crucial not just for in-house data but also for the overall smooth management of every component of business intelligence tools.
Checking and updating security protocol:
Most importantly, or rather more obviously, another component that businesses cannot afford to lose out on is security protocol. With the extensive use of cloud technology, security risks are higher, and therefore require the constant upgradation of cutting-edge security measures to fight against cloud security threats. A simple breach could cause loss of sensitive data and repeated damaging attacks that could devastate the business. Business intelligence tools like AI have dedicated protective platforms that could avert a crisis even before occurrence that could otherwise be impossible for a human workforce to even control after a hack.
The need for big data and its smooth integration has been happening at a rapid pace in the past few years, and the current need of the hour is maximum utilization of these resources for a successful and disaster-free future for businesses. With a lot of businesses changing the current from the traditional to technological cores, the constant revision of algorithms is required to gain the edge over competitors. This year is all prepped for data-driven – innovation, discovery, and inventions.

Monday, September 11, 2017

Five Reasons Why Business Intelligence Implementation Can Fail


 While there are loads of advice on how to institute a business intelligence (BI) tool into an organization’s curriculum, there is hardly any foresight on how to turn the BI tool into a part of the organization’s culture for effective usage. Scientific facts state that a smartphone is a tool that people just flash for having a sense of belonging with the crowd and use it only for limited purposes, and thereby fail to expend the smartphone’s full capabilities. Similarly, BI tools are not effectively expended and thus lose their value or fade out over time. Consequently, the critical question is: is it the smartphone’s fault or the user’s?
Bill Hostmann, a vice president and renowned analyst at Gartner, stated that “Despite years of investing in BI, many IT organizations have difficulty connecting BI with the business, and to get business users fully involved and out of the ‘Excel culture’ “. Periodical surveys have indicated that the following five reasons are the root cause for the implementation of BI tools to fail:
  1. Using The BI Tool As A Depository :- There has to be an efficient system of data management and the tradition of transcription culture among the employees should be imbibed in their system and the business support team should aid in the process of constant result generation. Nobody used computers when they were introduced, but today the whole world of business is progressively built around computers.
  2. Not Allowing Free Flow Of Data :-  Often employees collect data from the BI tools and transcribe them into the excel sheets or other similar formats and leave it there. This leads to stagnation, thereby leading to withholding of analysis from being circulated around the company. When crucial data is unavailable, the BI tools become ineffective to produce competent results. Instead of just collecting data, employees should have the responsibility to feed their results back into the system and allow access to other users, failing which there would be a slow motion domino collapse of the data.
  3. Plugging In A Third Man To Get The Answers :-  When organizations hit a rock wall, they give up and bring in third-party experts to take care of their business needs. This results in business decisions being formed from an outside-source rather than an in-house expert. Only employees that are part of the organization will be able to tackle and estimate the businesses’ problems because to an outsider it’s just meaningless numbers. The individual has to take the pick at the buffet table and not eat from another’s plate.
  4. Play Against Strategy :-  Most employees just think about the BI tool installed as a one stop shop for answer, but they need to strategically equip themselves to use the tool to their advantage. This also means that the BI tool should be up to date with the market and quality checked to ensure that the data is not being lost in transaction. Having a combined team of IT experts and business analysts dedicated towards the BI tool will ensure quality results.
  5. Failing To Train And Adapt :-  Employees believe that they are always right and that the software is beneath them. Having a positive approach towards change and trying out a handy BI tool only makes life easier. A BI tool only provides a wider berth of data to swim in, so adapting with technology only showcases the employees potential and does not undermine them for using a resource.
In the words of James Richardson, a research director at Gartner, “Business users must take a leadership role in the BI initiative — only with their full engagement will investment in BI ever realize its potential.”

Sunday, August 6, 2017

5 Key Questions to Ask When Evaluating BI Tools

BI Tools Evaluation Criteria - Sigma_Infosolutions


Geoffrey Moore, an American organizational theorist, management consultant, has rightly said: “Without big data analytics, companies are blind and deaf, wandering out onto the web like deer on a freeway.” While the market has a growing variety of vendors for BI tools due to technological advancement, every tool is distinct in its own way. The overall picture may be comprehensive and a flashy demo may convince you that it is the right one, but to pick wisely businesses have to remember that the subtle differences between the tools are the main markers to be carefully considered.

To evaluate these differences, one has to first understand the business requirement and question the intricate aspects to get a better insight into the tool’s hidden limitations. Any tool that you pick should primarily be able to organize the surplus data and aptly generate business charted analysis or reports. There is no one model that can be used like a “super brain” to comprehend the business requirements and generate data on its own will.
Some of the basic questions to address before zeroing would be:

1)    Is the tool shallow in collating data?

Allow the business requirements to predetermine the tool’s function because a tool is an aid to the business and not the other way round. As most BI tools just look at the individual organizational silos and tend to miss out on collaborating coherent information, an ideal BI tool should collate information from the entire business operation, analyze the core functional areas, compare data from multiple types of ERP and external data sources, and then generate a consolidated analytical model that involves all the intricacies.

2)    Does the tool generate a mere report or engage analysis? 

Businesses, most often, fail to see the difference between a summary report and an analytical report. The generated report should be able to map through all the different sectors and at the same time, the collated information should not be just a data mesh. Well, sorted data generation should be the key component for proper functioning in a BI tool.

3)    Is the data current or time-stale? 

The tools used in any form of business should generate data that is updated to the current numbers. If this is absent, then the data generated would be just figures of the past rather than the present. The tool should be well equipped to spontaneously downsize essential data in order to ensure that the business stays in the competition and does not get backlogged.

4)    How fast is the tool and how flexible it is? 

An effective BI tool which can turn out spontaneous reports with the collated information is a major advantage for proper projection of growth and damage control in an organization. Any tool that takes days to churn out information will be of no use to the business. Besides, just like technological evolution, the tool should be technically adaptable to the market trends as tools become easily outdated within few months at times.

5)    How soon can the BI tool be put into play and is it an all in one package?

While most organizations pick ready to use services, building custom BI tools should be quick too; as otherwise, the business would be overlaying progress without the requisite projections. Also, there is no one tool that fits the ideal package. Hence, businesses can try out trial runs and then pick one that fits their parameters and tweak the little details through their IT department in order to ensure that their needle in the haystack is sorted out.

Have you evaluated your BI tool on the above criteria? What are some primary factors you consider while evaluating Business Intelligence tools & services? Sigma’s BI services ensure flexibility on BI tools which are suited best for your business. Do leave your thoughts in the comments section below.

Friday, July 28, 2017

AI in BI – Intelligence,The Way Forward


Traditionally, business intelligence (BI) was restricted to business analysts who supplied information based on a collection of data over set time periods. The evolution of data and the collection of real-time data has greatly influenced the structuring of BI trends. The speed of data is imperative to drive timely actionable insights. Data that had been the metrics a day back would become stale within the next few days. Consequently, live access to data and its immediate interpretation has become the core of BI models. Like data, BI models too have started changing constantly with time bridging the time gap between data gathering and analysis.

The dawn of digitalization

The metrics of digitalization, consumerization, agility, security, analytics, cloud, and mobile are also simultaneously influencing the changing landscape of BI. One of the revolutionizing ideas that are taking form for better BI control is Artificial Intelligence, the AI. This has become a new face in the BI space as real-time data crunching has become more demanding for second by second analysis. Using the evolution of built in algorithms and age-old data analysis tools, businesses could build effective models through AI. It makes the data not just live but also visualized for effective analysis.

Current tech landscape of AI
The purpose of business analytics is to answer and project what the future holds. Artificial Neural Networks (ANN) and Autoregressive Integrated Moving Average (ARIMA) are two common techniques that are enabling better BI under predictive analysis. While the ANN models work just like the neurons of the human body in trying to chain the data into visualization, the latter technique, ARIMA, is concentrated on time series analysis that predicts scenarios by synchronizing both the past and current data.

Besides providing real time data analysis tools, Artificial Intelligence (AI) is indeed engulfing the business intelligence. We have witnessed several business modules incorporating AI models for efficient functioning and success of their business models. It would be safe to say that some of the areas where AI has been quite successful would be in sales, general electric companies that deal with intricate repairing of machinery, hospitals and in certain cases to monitor machine fleets and factories. If we are not convinced with the fact that AI is slowly taking over BI – here is a fact for you – AI is now the new decision maker! If you are looking for a smart business partner, you know who to reach out to next! This brings a rather intriguing quote from Woodrow Wilson, who has stated: “We should not only use the brains we have but all that we can borrow.” Ain’t that quaint?

The way forward

We have seen upscale in BI technologies such as cloud analytics and embedded integration systems all through the year 2016 and they will continue to reign the BI world since smaller businesses are still in the process of shifting gears into bigger technology. The year 2017 has been predicted by business analysts as the year for businesses to start migrating into the technologically advanced BI models.

Here is a million dollar question – Are you leveraging BI to your strength?

Drop a comment, and I’d be happy to discuss the future of BI with you.
Software Development Blogs - BlogCatalog Blog Directory RSS Search Technology Blogs - Blog Rankings Blog Directory